The most glamourous event of the last weekend was, with no doubt, the British royal wedding of Prince Harry and Meghan Markle.
Despite that, as you can imagine, that’s not the main topic of this post. Actually, we are going to explore some insights of the British Royal Family with the linked data graph of Wikdata and data visualization capabilities of its SPARQL endpoint.
Table of contents
Open Table of contents
Wikidata in a nutshell
Nowadays, Wikidata is definitely one of the most relevant central hubs of five-star linked data, counting more than 48M data items.
As the prefix Wiki- suggests, anyone can contribute by adding new information. You can add data if you are a Linked Data guru and you are extremely familiar with RDF. Interestingly enough, you can contribute as well if you do not have such an expertise. If that is the case, a web-based interface and its back-end manage linked data complexity for you with no pain.
Here is exactly where Wikidata really shines. Gurus and data lovers do join their effort to build and to maintain this “free and open knowledge base that can be read and edited by both humans and machines”. Indeed, Wikidata stores structured data!
Wikidata acts as central storage for the structured data of its Wikimedia sister projects including Wikipedia, Wikivoyage, Wikisource, and others.
Exploring data
Imagine you want to know who is the wife of Prince Harry.
If you search Wikidata for “Prince Harry”, you get his page, where there is a considerable collection of statements about him.
For example, you get his date of birth, the place of birth, his height and so forth. There is also the information we were looking for.
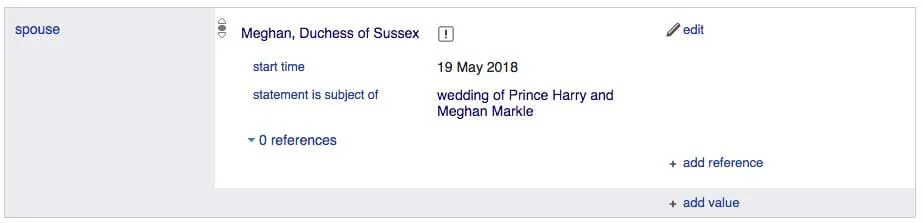
That statement tells us that Prince Harry married Meghan Markle on 19th May 2018.
Pretty cool! Anyway, there is nothing different from the classic user experience with Wikipedia so far. It’s time to leverage the structured nature of Wikidata information.
The SPARQL endpoint
If you want to explore data in a structured fashion, you might want to use Wikidata query service. There is also a query assistant that allows users to create or modify an existing query without mastering SPARQL, the RDF Query Language.
Besides, Wikidata endpoint can display results with different flavors. Let’s see some royal examples.
Table view (default)
The default visualization of query results is the table. We might want to ask who are the members of the House of Windsor. Here is the SPARQL query:
SELECT ?member ?memberLabel
WHERE
{
  ?member wdt:P53 wd:Q81589
  SERVICE wikibase:label { bd:serviceParam wikibase:language "en". }
}
We get the result as an interactive table like this one.
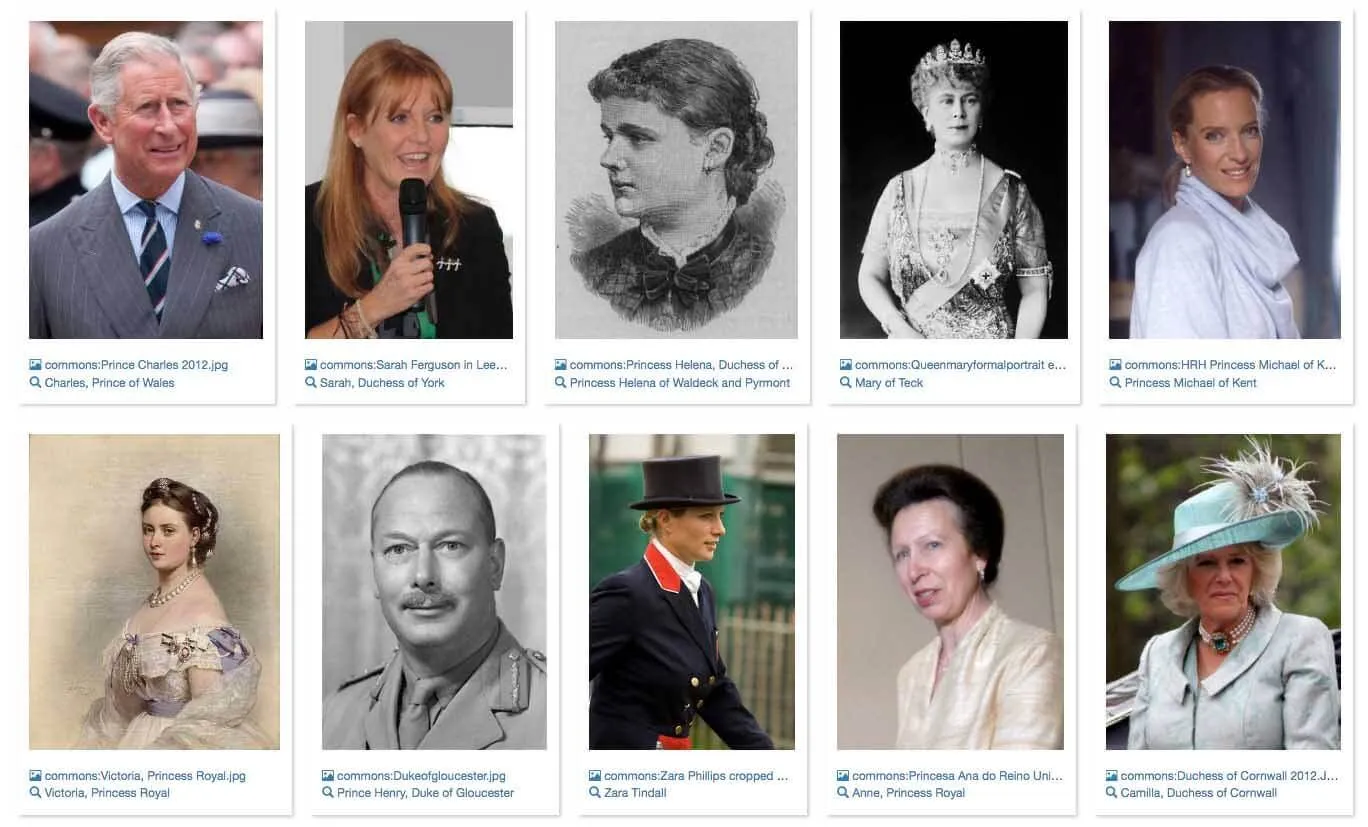
Image Grid View
If we wanted something different, we can ask Wikidata endpoint to show available
pictures of House of Windsor people as a grid with images. We just need to add
#defaultView:ImageGrid before the query.
#defaultView:ImageGrid
SELECT ?member ?memberLabel ?pic
WHERE
{
  ?member wdt:P53 wd:Q81589 ;
          wdt:P18 ?pic
  SERVICE wikibase:label { bd:serviceParam wikibase:language "en". }
}
and we get the following grid.
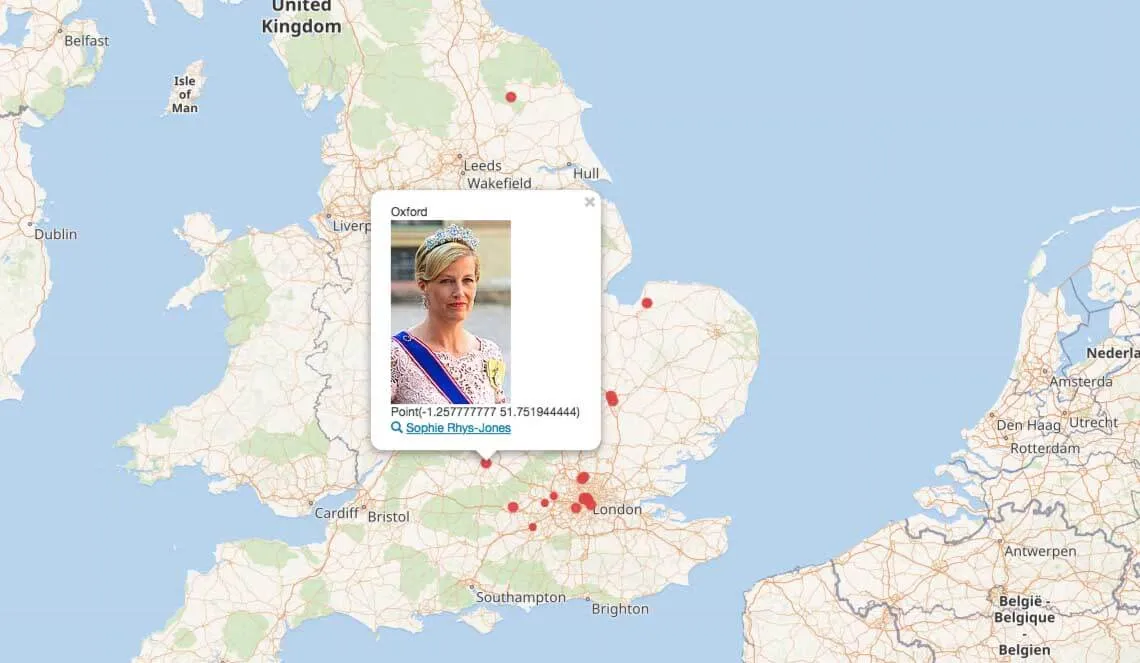
Map View
Interested in geographical data? Wikidata endpoint can easily show results in a
map if we get coordinates datatypes. The top line we need this time is
#defaultView:Map. Let’s look for birth places
of Windsor members.
#defaultView:Map
SELECT ?member ?memberLabel ?placeLabel ?coord ?pic
WHERE
{
  ?member wdt:P53 wd:Q81589;
          wdt:P19 ?place.
  OPTIONAL {
    ?member wdt:P18 ?pic
  }
  ?place wdt:P625 ?coord
  SERVICE wikibase:label {bd:serviceParam wikibase:language "[AUTO_LANGUAGE],en".}
}
Birth places are displayed in Open Street Map as dots. Note that pop-ups are available out of the box for texts and images.
Timeline View
If your focus is the time, you might be interested in visualizing events along a
timeline. For example, we can plot dates of birth
of Windsor family members by specifying #defaultView:Timeline.
#defaultView:Timeline
SELECT ?member ?memberLabel ?date ?pic
WHERE
{
  ?member wdt:P53 wd:Q81589;
          wdt:P569 ?date.
  OPTIONAL {
  ?member wdt:P18 ?pic
  }
  SERVICE wikibase:label { bd:serviceParam wikibase:language "en". }
}
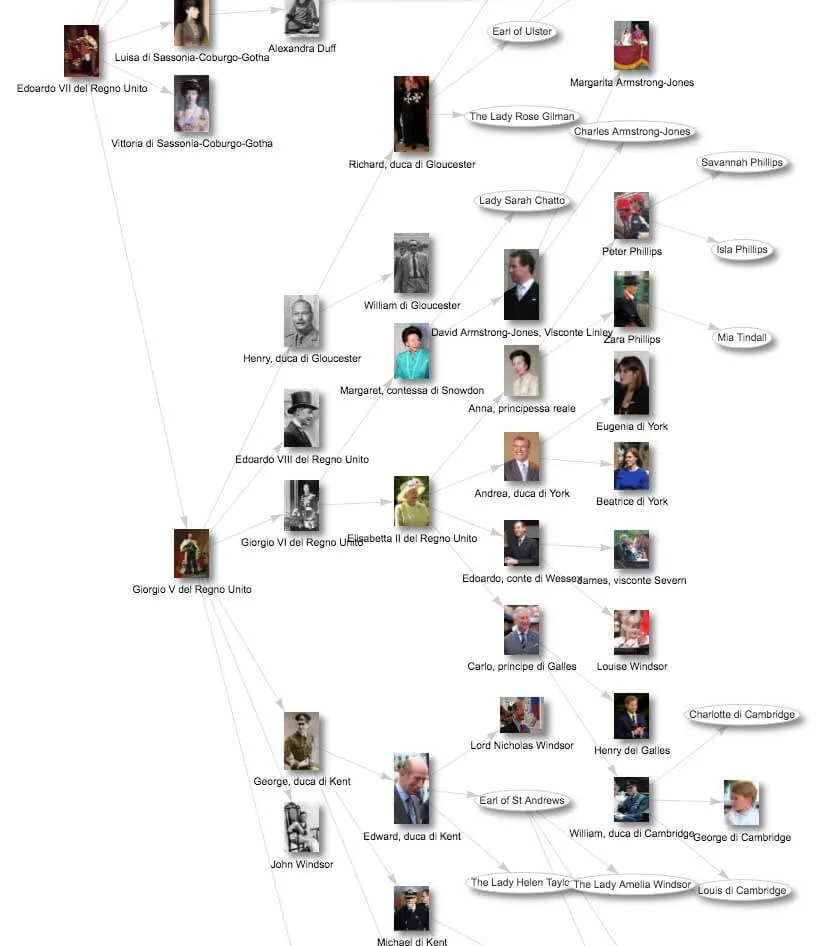
Graph View
Are you mad about relations? The #defaultView:Graph will be your superhero.
With the following query, we get British royal descendants since Edward VII.
#defaultView:Graph
SELECT ?item ?itemLabel ?pic ?link
WHERE
{
  wd:Q20875 wdt:P40* ?item
  OPTIONAL {?item wdt:P40 ?link }
  OPTIONAL {?item wdt:P18 ?pic }

  SERVICE wikibase:label { bd:serviceParam wikibase:language "en". }
}
and here is the result
Conclusions
Besides those examples, Wikidata endpoint offers also further turn-key solutions for visualizing results of queries on structured data.
Those are just basic entry points, though. They are as basic as useful. We can rely on them for first data explorations, without building our own visualization logic.
^..^